Create Custom Reports in Freshdesk for Free Using the Export Function
Are you using Freshdesk and feeling limited by the reporting features available on your plan? Maybe you're managing a small team or a startup and aren't ready to upgrade to an expensive plan just for reporting purposes. The good news? You can still create custom reports without paying extra by leveraging Freshdesk's export function and using tools you already have—like Excel or Google Sheets.
In this post, I’ll walk you through how to export your Freshdesk data and turn it into actionable reports, all without upgrading your plan. Let’s dive in!
1. Exporting Data from Freshdesk: Your First Step to Custom Reports
The first step is exporting your data from Freshdesk. You can easily export your tickets, contacts, or other useful information into a CSV file, which can be opened with any spreadsheet software like Excel or Google Sheets.
Here’s how to do it:
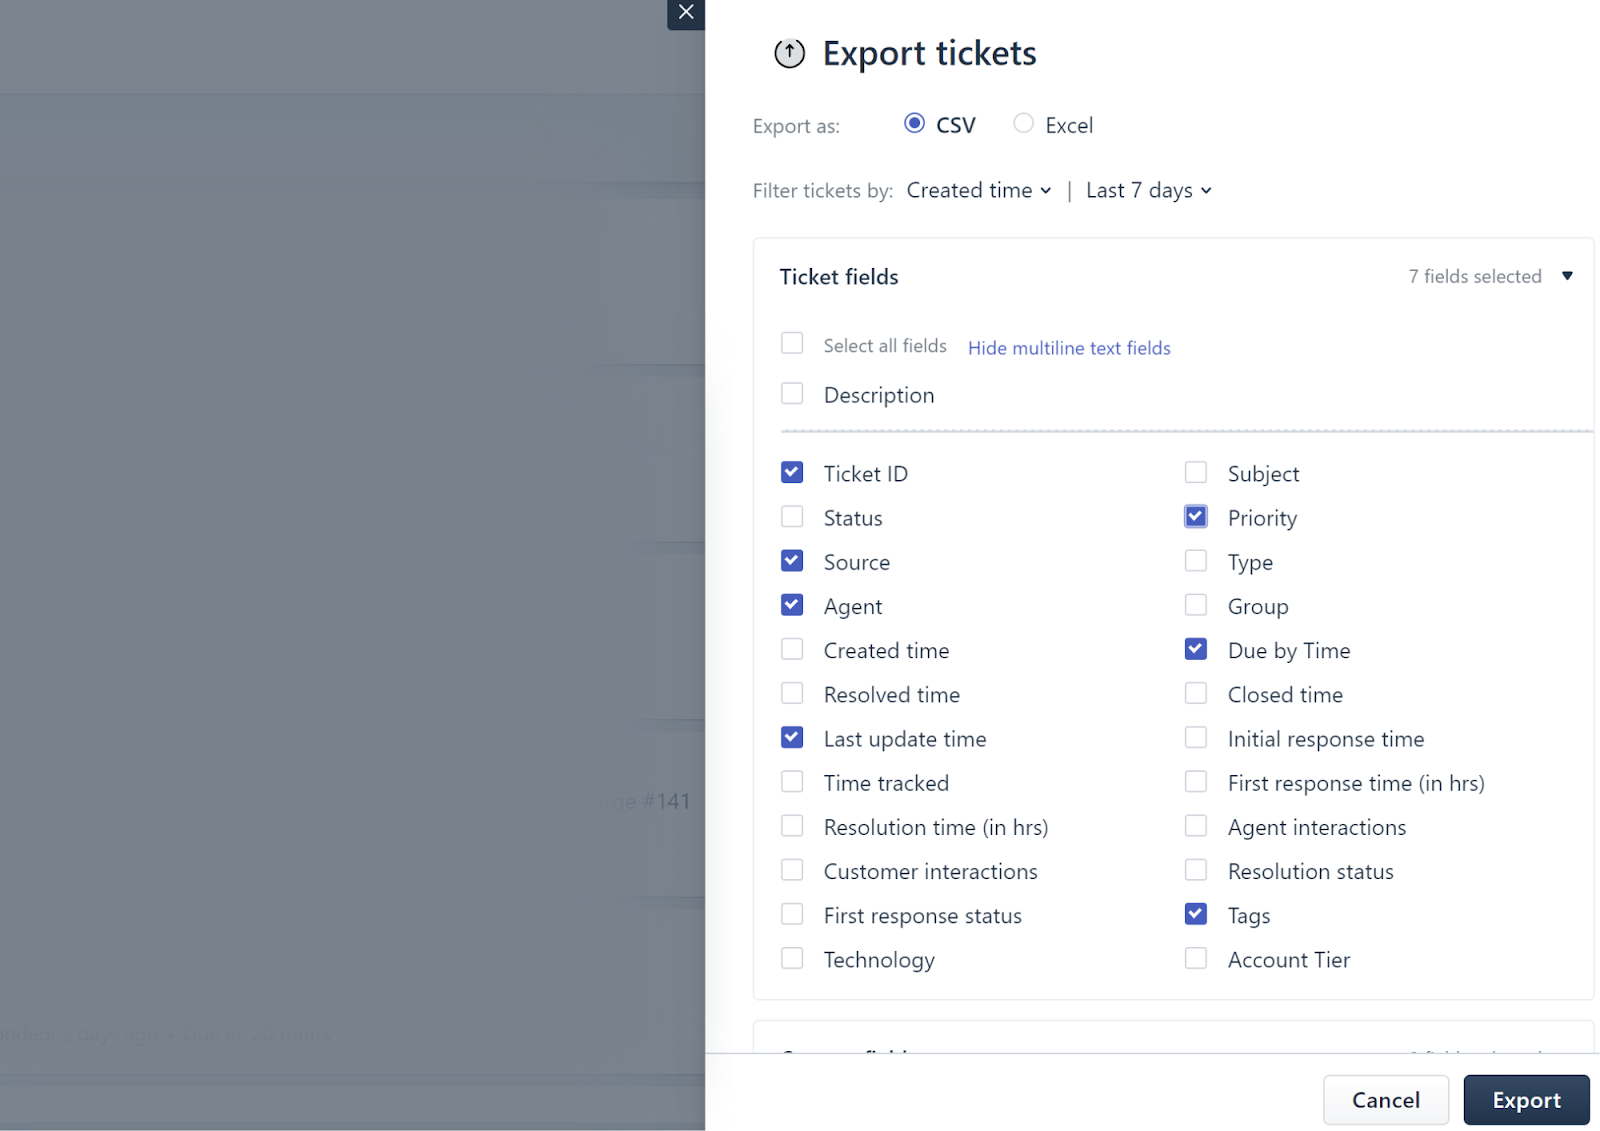
- Head to the “Tickets” section
- Click the Export button
- Select the “Time period”
- And then, choose the data that you would like to export
Now that you have your data, it’s time to make sense of it!

2. Turn Data into Insights Using a Spreadsheet
Once you’ve exported your data, the real magic happens. Whether you're comfortable with Excel or prefer Google Sheets, both offer powerful ways to manipulate the data and turn it into useful insights.
Here’s what you can do:
- Open the CSV in your spreadsheet tool: Excel or Google Sheets can easily open CSV files. Simply import the data and you’ll see it neatly laid out in rows and columns.
- Use Pivot Tables: Pivot tables are your best friend when it comes to organizing data. Want to see how many tickets each agent has resolved? Or track how many high-priority tickets came in last month? Pivot tables will help you drill down into specific areas of your support performance.
- Apply Formulas: Using basic spreadsheet formulas, you can calculate things like average response times, resolution rates, or how long it takes to resolve a ticket. Formulas let you extract key performance metrics with just a few clicks.
3. Automate the Process (For Regular Reports)
If you find yourself needing to generate these reports on a regular basis, you might want to automate parts of the process to save time.
- In Google Sheets: You can use Google Apps Script to automate importing data, so you don’t have to manually upload the CSV every time.
- In Excel: You can use macros to automate formatting, calculations, or organizing the data once it’s imported. That way, it’s ready to go with minimal effort each time you run the report.
This will cut down on time spent redoing the same steps, especially if you’re running weekly or monthly reports.
4. Create Dashboards to Visualize Your Data
Once you’ve set up your data in Excel or Google Sheets, why not create a dashboard to visualize key metrics?
Some ideas for data to track in your custom dashboards:
- Ticket Resolution Time: Track how long it’s taking your team to resolve tickets.
- Agent Performance: Highlight who’s closing the most tickets and how fast.
- Customer Satisfaction (CSAT): If you have CSAT scores, you can easily track trends over time.
- Ticket Breakdown by Priority or Channel: Identify how many tickets are coming in through chat, email, or social, and see which ones are labeled as high-priority.
Dashboards let you keep an eye on key performance indicators (KPIs) and give you a snapshot of your support performance at a glance.
5. For Advanced Reporting, Use BI Tools
If you’re looking to go beyond what spreadsheets can offer, consider using a Business Intelligence (BI) tool like Power BI or Tableau. These tools allow for deeper data analysis and more sophisticated reporting capabilities. You can import the CSV data from Freshdesk, build interactive dashboards, and even set up automated data pulls if you’re comfortable with some technical setup.
But for most users, Excel or Google Sheets will do the job just fine, without the steep learning curve!


